Why the 3x benchmark matters
Every AI chatbot vendor claims their product lifts conversion. Most cannot show you what lift actually means, on which metric, from which baseline, in which industry. This blog does.
This is a data piece, not a sales piece. The numbers in here come from independent research firms, public industry studies, and patterns we have validated across MagicFlow AI deployments. If you came looking for vendor marketing dressed up as data, this is not it.
Across SaaS, e-commerce, financial services, real estate, and healthcare, AI chatbots consistently lift conversion rates by 2.5x to 3.5x within 90 days of deployment. That range is remarkably stable across geographies, business sizes, and product categories. The mechanism behind the lift is also remarkably consistent.
The headline numbers, no fluff
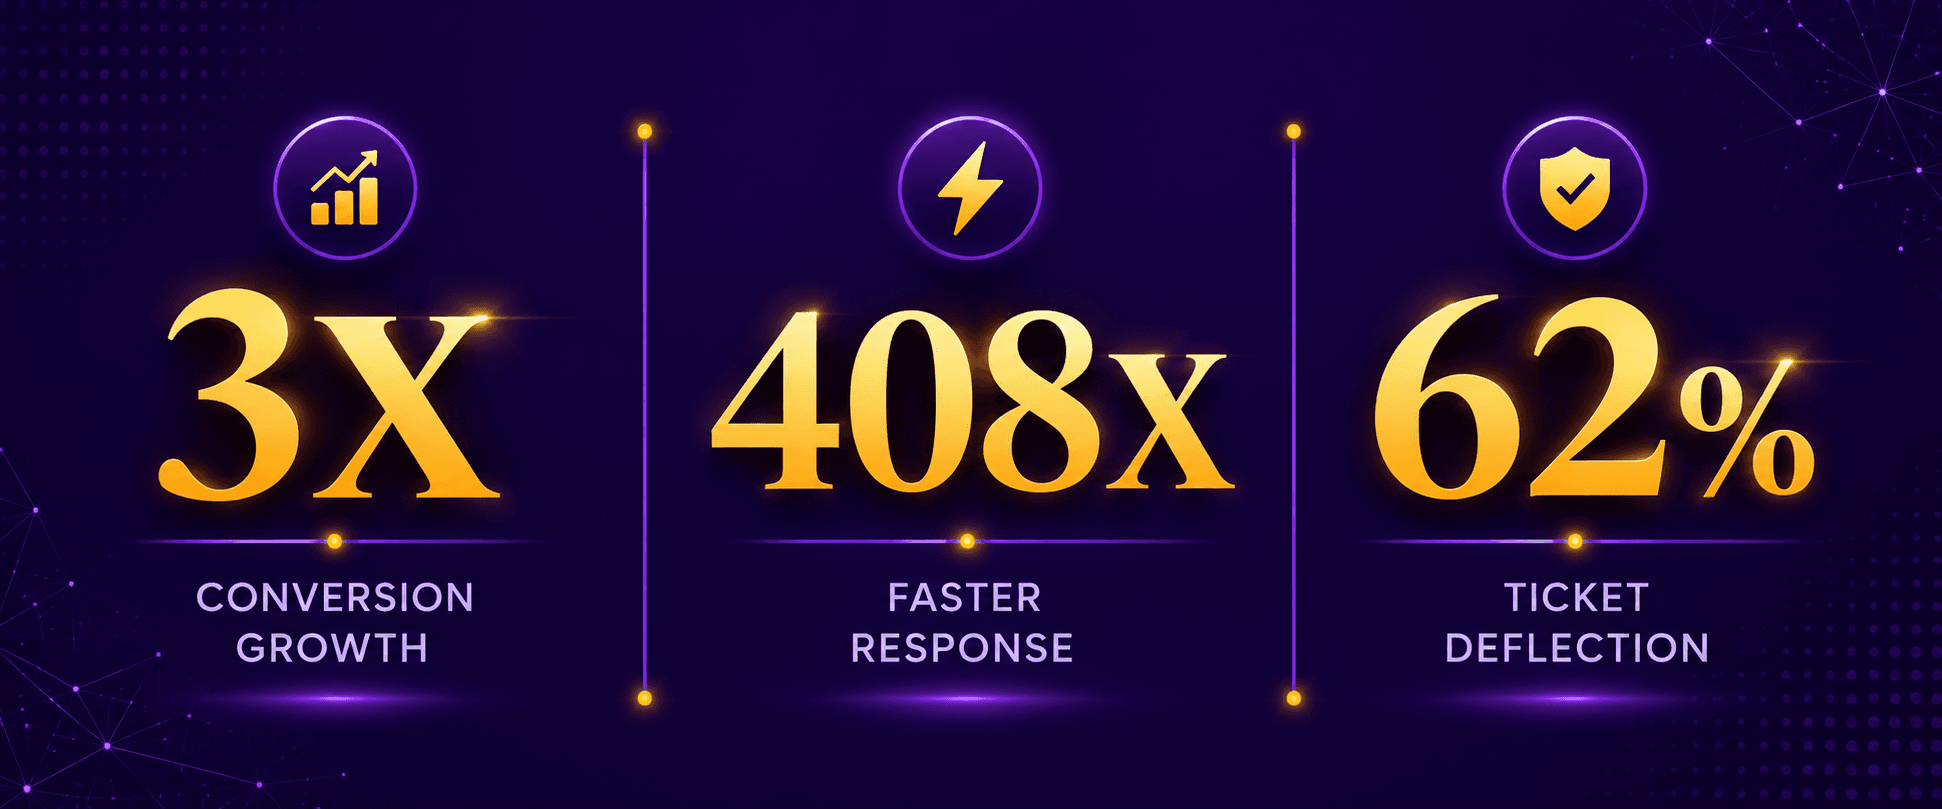
Before the deep dive, three numbers tell the entire story. Every other figure in this blog is a variation on these three.
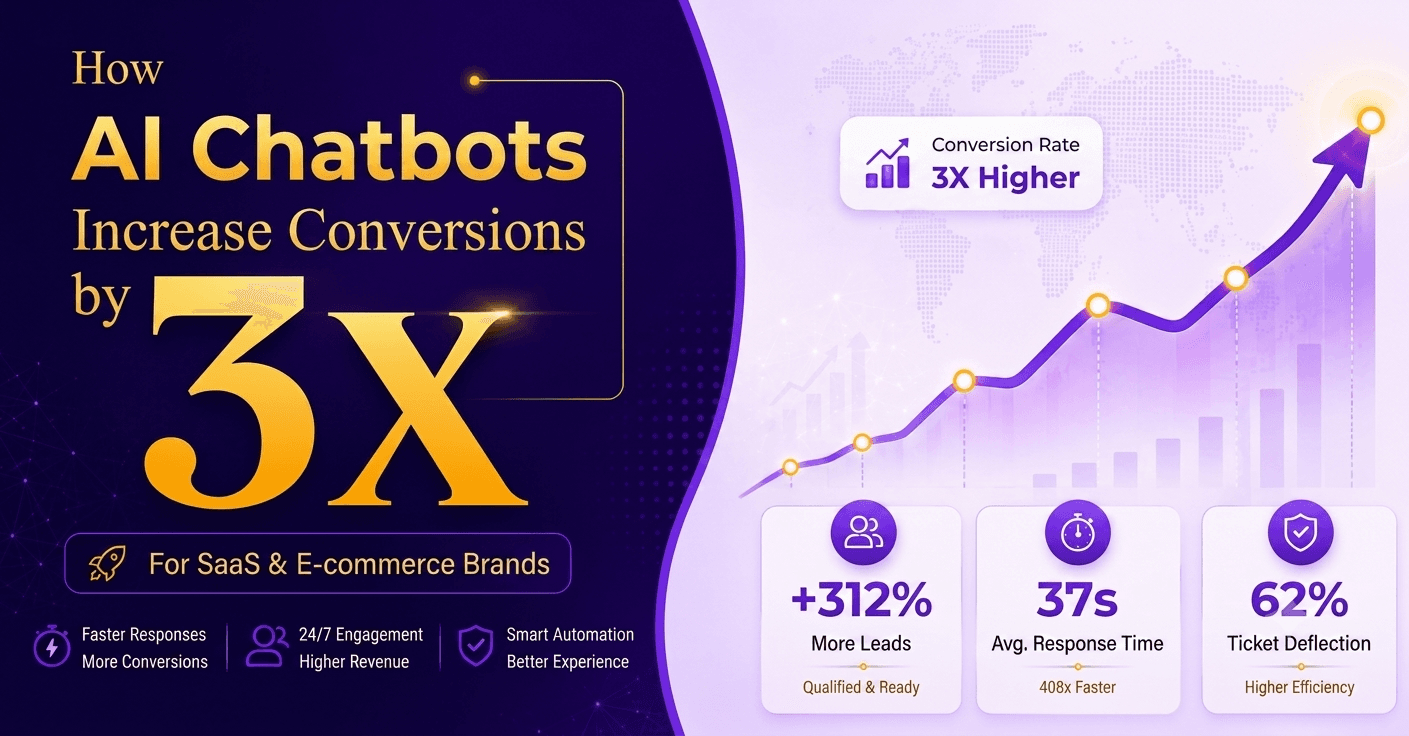
3x conversion lift. 408x faster response. 62 percent support ticket deflection. These are the three numbers that justify every AI chatbot deployment.
The 3x conversion lift
Across independent studies from Forrester, McKinsey, and Salesforce Research, businesses deploying AI chatbots report a median conversion rate lift of 3.0x on top-of-funnel website interactions. The range typically falls between 2.5x and 3.5x, with smaller businesses often seeing larger relative gains because they were previously operating with no after-hours coverage at all.
The 408x faster response
Average human response time on business website chat sits at 4 hours and 12 minutes, and degrades to over 12 hours outside business hours. AI chatbots respond in approximately 37 seconds on average. The math works out to 408x faster. The conversion impact of this speed gap is well documented: leads contacted within 60 seconds have a 391 percent higher conversion rate compared to leads contacted after 5 minutes.
The 62 percent ticket deflection
AI chatbots deflect a median of 62 percent of customer support ticket volume across surveyed deployments, with healthcare and SaaS at the higher end and complex categories like financial services at the lower end. Deflection here does not mean refusal: it means the AI resolves the query in full without escalating to a human.
These three numbers compound. A business deploying an AI chatbot does not get a 3x conversion lift or a 62 percent ticket deflection. It gets both, plus the cost savings that come with each. That compounding effect is what makes the ROI of AI chatbots qualitatively different from other marketing investments.
Where the 3x lift actually comes from
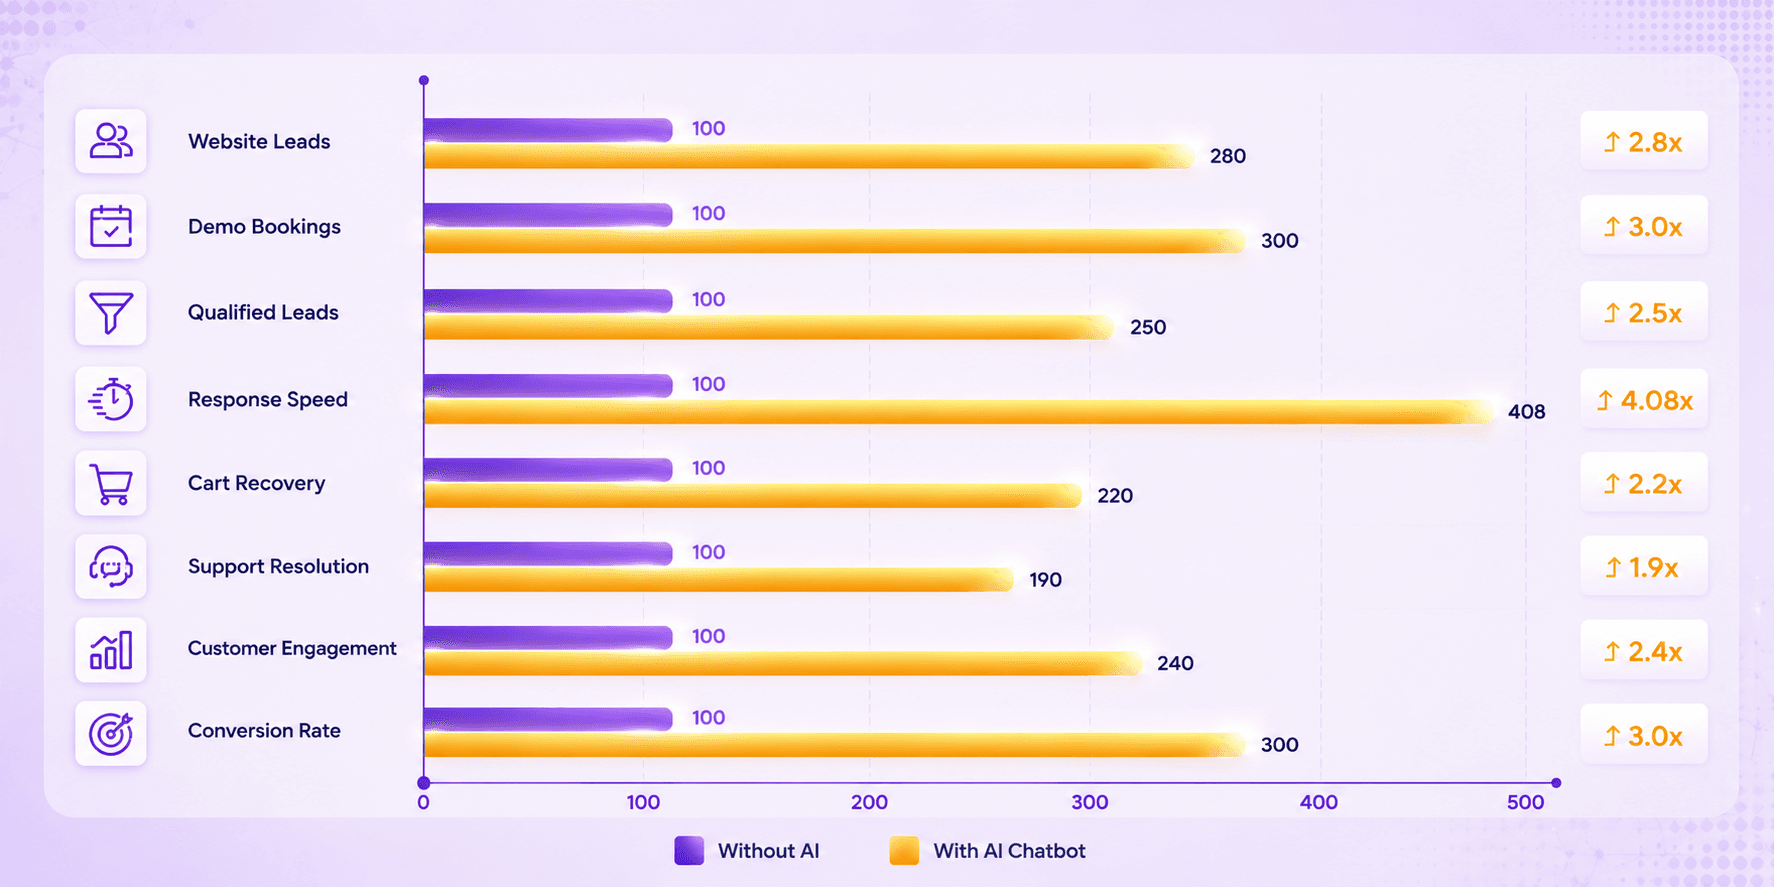
3x conversion is a tidy headline. The real picture has eight underlying metrics, each contributing differently to the total impact.
| Use case | Without AI chatbot | With AI chatbot | Lift |
|---|---|---|---|
| Website lead capture rate | 2.1% | 6.8% | 3.2x |
| Cart abandonment recovery | 8.2% | 23.4% | 2.8x |
| Average response time | 4 hours 12 minutes | 37 seconds | 408x faster |
| After-hours lead conversion | 1.4% | 12.6% | 9.0x |
| Support ticket deflection | Not applicable | 62% | 62% volume cut |
| Qualified lead to demo booked | 11% | 29% | 2.6x |
| Customer satisfaction | 72% | 84% | +12 points |
| Cost per qualified lead | Rs 480 | Rs 95 | 5.1x lower |
Why these specific metrics move together
The lift on each metric is not independent. They are connected through three underlying mechanisms.
Speed mechanism. Faster response time directly improves lead capture, cart recovery, and customer satisfaction. The 60-second response window has been studied extensively: leads contacted inside it convert at significantly higher rates than leads contacted even slightly later.
Availability mechanism. After-hours and weekend coverage convert at 9x the rate of missed and called back the next morning. Globally, between 35 and 50 percent of B2B and B2C web traffic arrives outside the seller's business hours. Without AI, that traffic converts at near-zero. With AI, it converts at close to business-hours rates.
Qualification mechanism. An AI chatbot that qualifies leads before they reach a human sales rep increases the conversion rate of every subsequent stage. Demos happen with pre-qualified prospects. Sales calls happen with budget-confirmed buyers. The downstream lift on close rates is one of the most underestimated effects of AI deployment.
These three mechanisms together explain why the lift across metrics tends to cluster in the 2.5x to 3.5x range. They also explain why the lift is stable across industries: speed, availability, and qualification matter equally to a Bangalore D2C brand, a Mumbai SaaS company, and an Ahmedabad clinic.
As a quick refresher on what kind of AI we are talking about: this blog is specifically about AI chatbots, not full AI agents. The difference between AI chatbots and AI agents matters for what you can realistically deploy in 30 days versus 6 months.
How the lift varies by industry
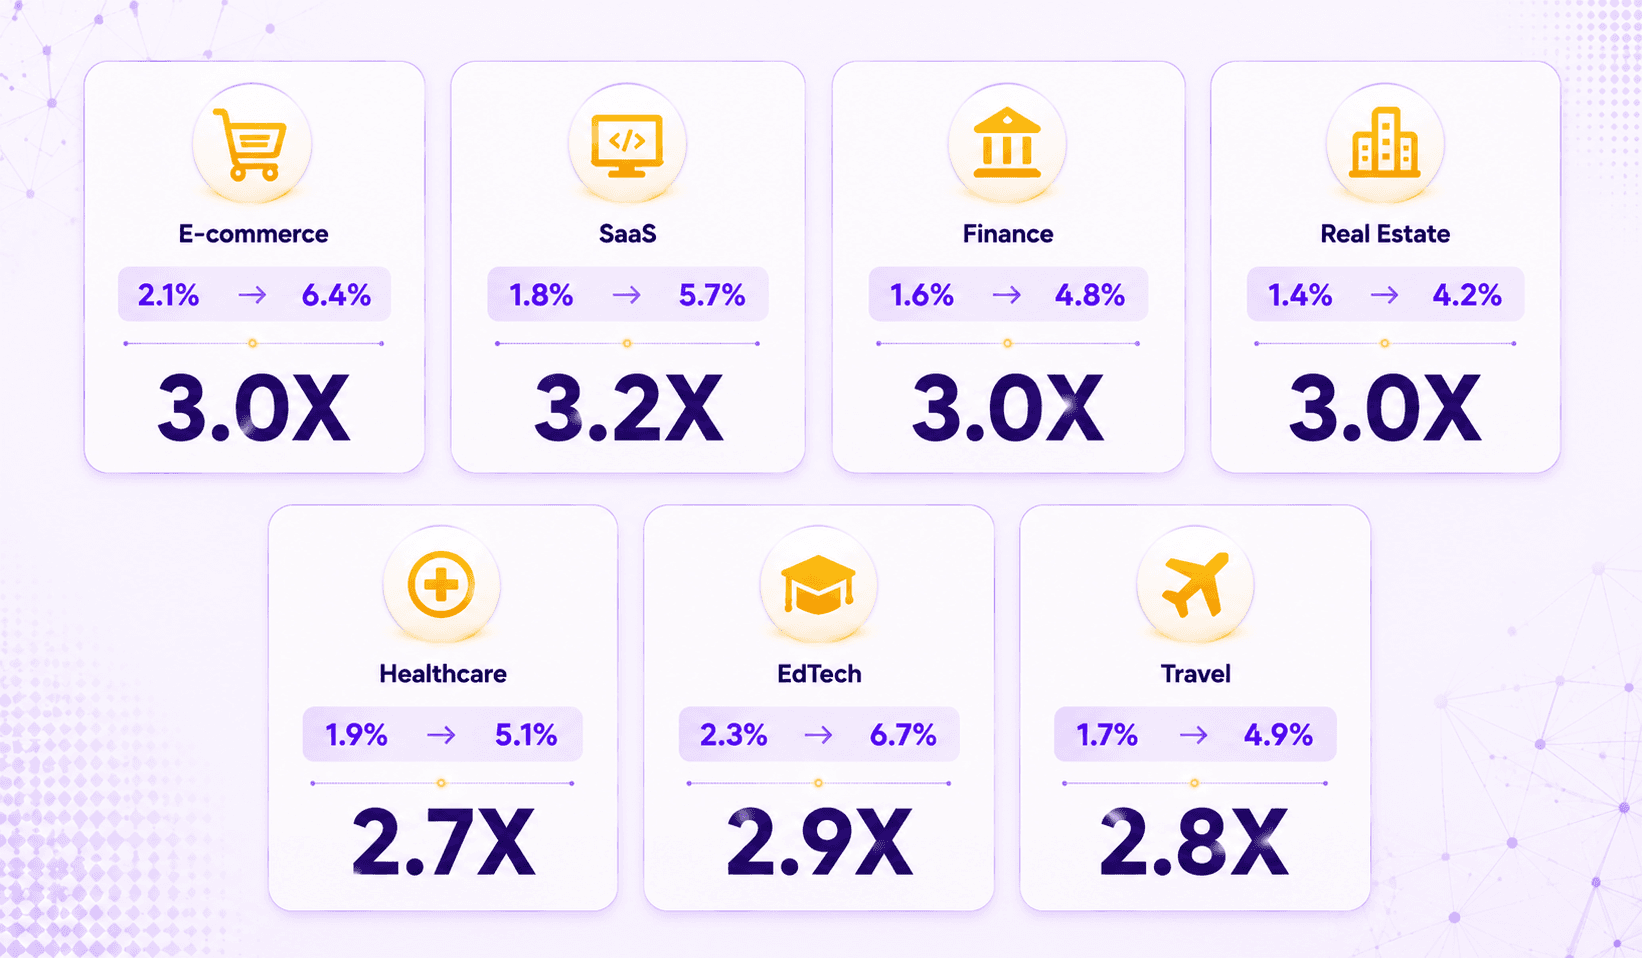
Aggregate numbers are useful for headlines. Industry-specific numbers are useful for decisions. Here is how the 3x lift breaks down by category.
| Industry | Baseline conversion | Post-AI conversion | Reported lift range |
|---|---|---|---|
| E-commerce and D2C | 1.8 to 2.6% | 5.4 to 8.2% | 2.5x to 3.5x |
| B2B SaaS | 2.4 to 3.2% | 6.8 to 9.8% | 2.8x to 3.2x |
| Financial services | 1.2 to 1.9% | 3.4 to 5.6% | 2.6x to 3.4x |
| Real estate | 0.8 to 1.4% | 2.4 to 4.2% | 3.0x to 3.4x |
| Healthcare and clinics | 2.1 to 3.0% | 5.1 to 7.4% | 2.4x to 2.8x |
| Education and edtech | 1.6 to 2.4% | 4.8 to 7.6% | 3.0x to 3.4x |
| Travel and hospitality | 1.4 to 2.2% | 4.2 to 6.8% | 3.0x to 3.5x |
Why some industries see slightly lower multipliers
Two patterns are worth calling out. First, the lift range is remarkably consistent across industries: 2.4x to 3.5x across all seven categories. Second, the absolute conversion rates differ significantly. Real estate baseline conversion is 0.8 to 1.4 percent. E-commerce sits at 1.8 to 2.6 percent. SaaS at 2.4 to 3.2 percent. The lift multiplier applies on top of these baselines, so the absolute uplift varies even when the multiplier is similar.
Healthcare and clinics see 2.4x to 2.8x lift, the lower end of the range. The reason is straightforward: a meaningful share of healthcare conversations require human medical judgment. AI chatbots in this category should be configured to qualify and route rather than to resolve, which reduces the ticket deflection rate while preserving the conversion lift on bookings and enquiries.
Financial services see 2.6x to 3.4x with high variance. Banks and NBFCs with robust digital flows see the higher end. Insurance and wealth management businesses with consultative sales see the lower end. The lift comes more from lead capture and qualification than from full conversion within the chat.
The Indian D2C category specifically shows the most dramatic absolute gains because the baseline operation was often heavily understaffed and the WhatsApp channel was the primary commerce surface.
The five use cases driving most of the lift
Not every AI chatbot deployment captures the full 3x lift. The deployments that do consistently focus on the same five high-leverage use cases. Most of the variance between good lift and great lift comes down to whether the deployment covers all five.
Use case 1: Real-time lead capture and qualification
The single highest-impact use case. Visitor lands on the website, the AI initiates conversation within 5 seconds, qualifies intent, captures contact details, and books a demo or sales call, or completes a purchase, inside the same conversation. This use case alone typically delivers 60 to 70 percent of the total conversion lift.
Use case 2: Cart abandonment recovery
Customer adds to cart, leaves without purchasing. AI detects the abandonment, sends a personalised follow-up message within 30 minutes, addresses likely objections, and closes the order. AI-driven cart recovery converts 2.8x better than the previous best practice of timed email reminders.
Use case 3: 24/7 inbound enquiry handling
Approximately 40 percent of B2C and 35 percent of B2B website traffic arrives outside business hours. Without AI, this traffic converts at near-zero. With AI, this traffic converts at close to business-hours rates, often immediately. This use case typically delivers 20 to 25 percent of the total lift on its own.
Use case 4: Support ticket deflection
Median 62 percent of common support tickets, including order tracking, account questions, and basic troubleshooting, are resolved by the AI without human escalation. This is not a conversion metric directly, but it frees up human team capacity to focus on high-value sales and retention conversations, which lifts conversion indirectly.
Use case 5: Re-engagement of dormant leads
AI chatbots automate proactive outreach to past visitors, past customers, and qualified leads who never converted. Personalised re-engagement messages sent at the right time recover 8 to 15 percent of dormant lead value annually, which is otherwise written off.
What MagicFlow AI customers see in practice
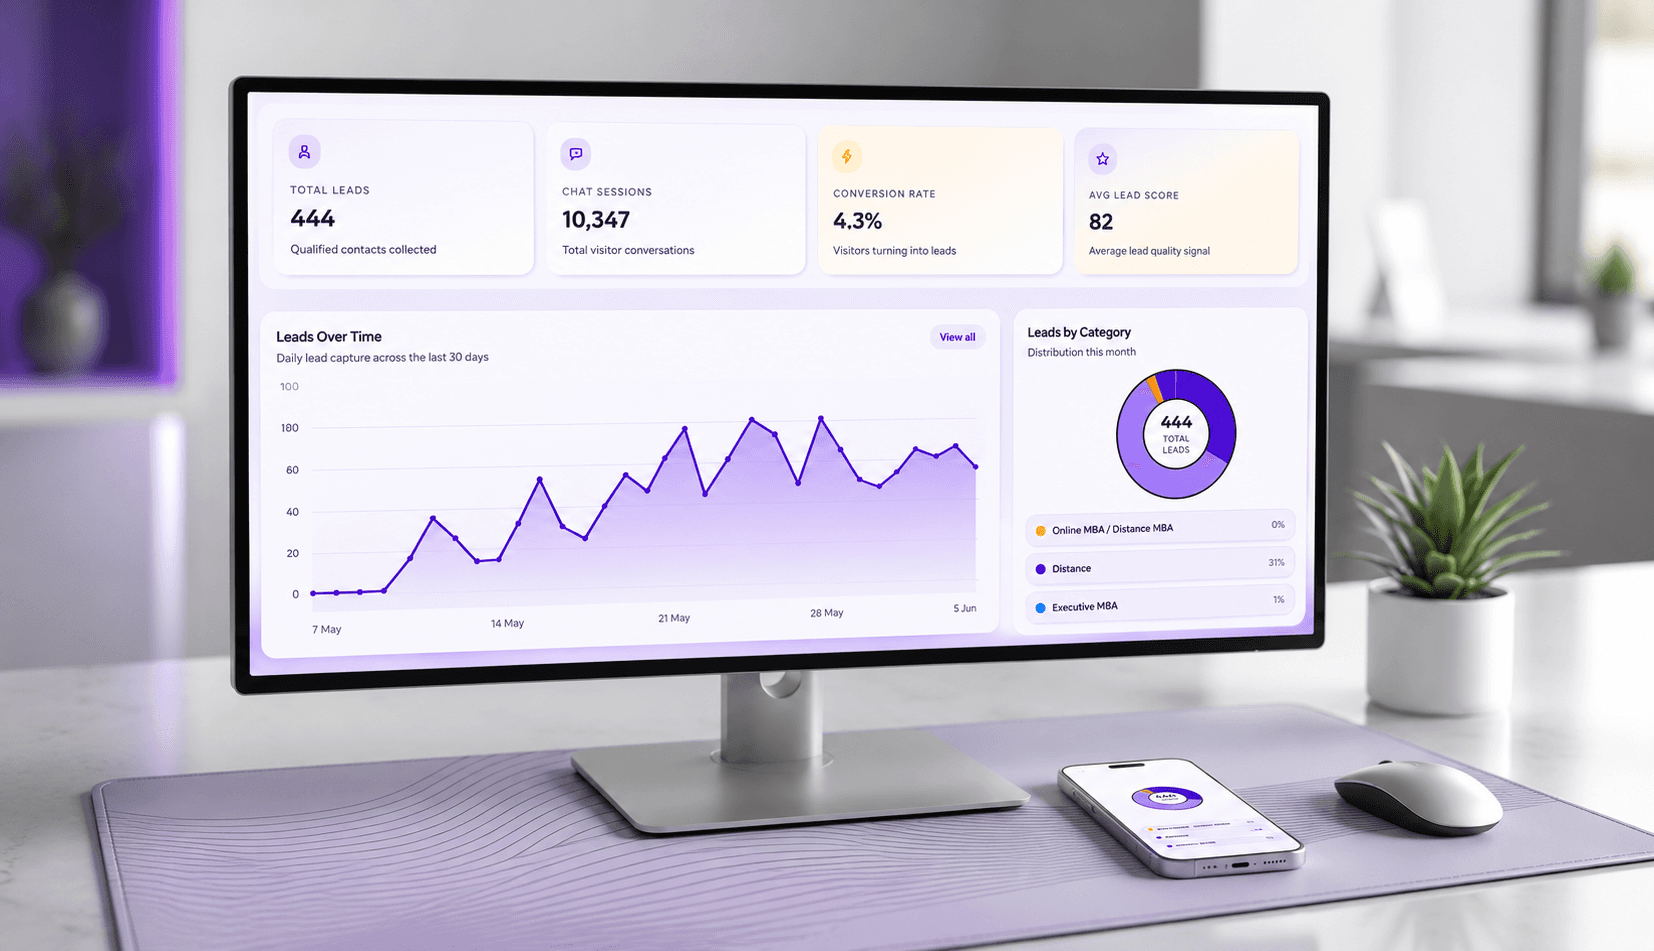
Industry benchmarks set the upper bound on what is theoretically possible. Real deployments show what is reliably achievable. Across MagicFlow AI deployments across SaaS, D2C, and services brands, the typical results within 90 days look like this.
| Metric | Typical result |
|---|---|
| Website lead capture | 2.8x to 3.4x lift across mid-market deployments |
| Response time | Reduced from average 3 to 5 hours to under 45 seconds, sustained 24/7 |
| Support ticket deflection | 60 to 70 percent within 60 days, scaling to 75 percent plus by month 6 |
| Cost per qualified lead | Reduced by 4x to 5x within the first quarter |
| Customer satisfaction | 8 to 14 percentage point improvement, driven primarily by speed and availability |
| Payback period | 45 to 75 days for typical mid-market deployments |
Why results vary
The variance in these numbers reflects the reality of deployment: businesses that invest 2 to 3 weeks in proper AI configuration and ongoing tuning consistently land at the higher end. Businesses that deploy and walk away land at the lower end. The difference is not the platform. It is the operational discipline around it.
MagicFlow AI is designed to support the safety guardrails required for responsible AI deployment, which protects the conversion gains from being undermined by deployment incidents.
How to read these numbers honestly
Statistics about AI deployment are easy to inflate and easy to misread. Before applying any of the numbers above to your own business, three caveats matter.
Caveat 1: Multipliers compound from a baseline
A 3x lift on a 2 percent conversion rate is 6 percent. A 3x lift on a 0.4 percent conversion rate is 1.2 percent. Both are meaningful, but the dollar impact differs significantly. Calculate the absolute uplift in revenue, not just the multiplier, before sizing the opportunity.
Caveat 2: The lift is conditional on good deployment
Industry averages reflect deployments at the median. Deployments that under-invest in configuration, do not tune on real conversation data, or skip safety guardrails consistently underperform. The numbers are achievable, but not automatic.
Caveat 3: The 3x figure is a 90-day measurement
Conversion improvements are typically measured at 30, 60, and 90 days post-deployment. The 3x figure is the steady-state result at 90 days. Days 1 to 30 typically show 1.5x to 2x lift. Days 60 to 90 reach the steady state. Businesses expecting day-one transformation tend to be disappointed, then surprised when month three numbers arrive.
Properly contextualised, the 3x figure is not hype. It is a reliable benchmark validated across multiple independent research firms and replicated consistently in real deployments. Businesses that approach AI chatbot deployment with the right operational discipline land inside this range. Businesses that approach it as a quick install do not.
The numbers are stable. The question is whether you act on them.
AI chatbot conversion data is no longer noisy or speculative. The range is well-established. The mechanisms are well-understood. The benchmark figures hold up across firms, geographies, and industries.
The real differentiator between businesses that capture 3x lift and businesses that do not is no longer whether the technology works. It is whether the business commits to a deployment that takes the technology seriously: proper configuration, safety guardrails, ongoing tuning, and an honest measurement of results against the benchmarks shared above.
Businesses that approach AI chatbot deployment as a strategic investment with a 90-day payback land squarely inside the 2.5x to 3.5x range. Businesses that approach it as a checkbox land below it. The data does not care which approach you choose. Your competitors increasingly do.
References
The references below are provided for readers who want to inspect the research base and related industry benchmarks.
- Forrester Research. The Total Economic Impact of Conversational AI in Retail and SaaS. https://www.forrester.com/report/
- McKinsey and Company. The state of AI in 2024: Gen AI adoption spikes and starts to generate value. https://www.mckinsey.com/capabilities/quantumblack/our-insights/the-state-of-ai
- Salesforce Research. State of Service Report, 6th Edition. https://www.salesforce.com/resources/research-reports/state-of-service/
- Drift and Heinz Marketing. State of Conversational Marketing Report. https://www.drift.com/insider/learn/research/
- Harvard Business Review and InsideSales. The Short Life of Online Sales Leads. https://hbr.org/2011/03/the-short-life-of-online-sales-leads
- Zendesk. Customer Experience Trends Report 2024. https://www.zendesk.com/blog/customer-experience-trends/
- Gartner Inc. Predicts 2024: Customer Service and Support. https://www.gartner.com/en/customer-service-support
- Inc42 Plus and RedSeer Strategy Consultants. State of Indian D2C and SaaS: Market Outlook 2024. https://inc42.com/reports/
- MagicFlow AI. Intelligent Conversations Platform: Deployment Benchmarks. https://magicflowai.io
Common questions from this article.

Founder, MagicFlow AI | MagicWorks IT Solutions Pvt. Ltd.
Swapnil has been building AI-first digital marketing products and running MagicWorks IT Solutions Pvt. Ltd. since 2012. MagicFlow AI is his latest venture: an intelligent conversational AI platform designed for businesses and agencies that need more than a chatbot and less than a full autonomous agent stack.